Reference
Incoming water temperature for water heater sizing
Your incoming (mains) water temperature sets the temperature rise a heater must provide. Measure it at a cold tap in winter if you can. If you can’t, the city estimates below give a reasonable starting point, accurate to roughly ±5°F.
Updated
Why it matters so much
Every degree colder the incoming water is, the more heat the water heater has to add. For tankless, the effect is direct: two showers need 112,500 BTU/hr with 60°F water but 162,500 BTU/hr with 40°F water, 44% more. For a tank, blended fixtures draw more from the heater when the cold side is colder: the same busiest hour needs an FHR of 54 gallons at 60°F but 58 at 40°F.
It also matters because published ratings assume 58°F supply water. A tank’s First Hour Rating and a tankless unit’s maximum GPM are both measured at 58°F, so in colder water both deliver less than advertised.
How to measure it
- Pick a cold tap close to where the water line enters the house, before any softener or filter tank if possible.
- Run it for several minutes, until the temperature stops dropping. The first water has been sitting in warm pipes.
- Hold a probe thermometer in the stream and read it once it settles.
- Repeat in the coldest month. Mains water is usually coldest in late winter, weeks after the coldest air, because the ground cools slowly.
A tankless unit that shows inlet temperature on its display or app is another quick source once installed.
Estimated mains water temperature by city
No public agency publishes a table of tap-water temperatures by city, and the groundwater maps you’ll find online rarely say where their numbers come from. So these estimates are calculated: NOAA’s 1991–2020 climate normals for each city’s airport station, run through the mains-temperature correlation developed at the National Renewable Energy Laboratory and used in the EnergyPlus building simulation program.
| City | Annual air | Mains, average | Mains, coldest | Winter rise to 120°F |
|---|---|---|---|---|
| Duluth, MN | 41 | 47 | 36 | 84 |
| Anchorage, AK | 38 | 44 | 36 | 84 |
| Minneapolis, MN | 47 | 53 | 40 | 80 |
| Milwaukee, WI | 49 | 55 | 44 | 76 |
| Detroit, MI | 51 | 57 | 45 | 75 |
| Chicago, IL | 51 | 57 | 45 | 75 |
| Denver, CO | 51 | 57 | 47 | 73 |
| Pittsburgh, PA | 52 | 58 | 47 | 73 |
| Boston, MA | 52 | 58 | 47 | 73 |
| Boise, ID | 53 | 59 | 48 | 72 |
| Salt Lake City, UT | 55 | 61 | 48 | 72 |
| Columbus, OH | 54 | 60 | 48 | 72 |
| Kansas City, MO | 55 | 61 | 48 | 72 |
| New York, NY | 56 | 62 | 50 | 70 |
| St. Louis, MO | 57 | 63 | 51 | 69 |
| Philadelphia, PA | 56 | 62 | 51 | 69 |
| Albuquerque, NM | 58 | 64 | 53 | 67 |
| Washington, DC | 59 | 65 | 53 | 67 |
| Seattle, WA | 54 | 60 | 53 | 67 |
| Portland, OR | 55 | 61 | 54 | 66 |
| Oklahoma City, OK | 60 | 66 | 54 | 66 |
| Nashville, TN | 61 | 67 | 55 | 65 |
| Charlotte, NC | 61 | 67 | 56 | 64 |
| Atlanta, GA | 64 | 70 | 59 | 61 |
| Sacramento, CA | 62 | 68 | 60 | 60 |
| Dallas-Fort Worth, TX | 67 | 73 | 60 | 60 |
| San Francisco, CA | 59 | 65 | 61 | 59 |
| Las Vegas, NV | 70 | 76 | 61 | 59 |
| San Antonio, TX | 70 | 76 | 65 | 55 |
| Los Angeles, CA | 64 | 70 | 66 | 54 |
| Houston, TX | 71 | 77 | 66 | 54 |
| San Diego, CA | 65 | 71 | 66 | 54 |
| New Orleans, LA | 71 | 77 | 67 | 53 |
| Phoenix, AZ | 76 | 82 | 67 | 53 |
| Tampa, FL | 75 | 81 | 73 | 47 |
| Miami, FL | 77 | 83 | 78 | 42 |
| Honolulu, HI | 78 | 84 | 81 | 39 |
Treat these as estimates. The correlation’s authors report errors of about 4°F on average across their test sites and note that mains temperature varies by ±5°F across a single water network. Its worst fit was Duluth, Minnesota, off by about 13°F. Cities that draw from mountain reservoirs, snowmelt or deep wells can differ more. A measurement beats any table.
How the estimate is calculated
mains(day) = (Tavg + 6) + ratio × (ΔT ÷ 2) × sin(0.986 × (day − 15 − lag) − 90) ratio = 0.4 + 0.01 × (Tavg − 44) lag = 35 − 1.0 × (Tavg − 44) days Tavg = annual mean air temperature, °F ΔT = warmest monthly mean − coldest monthly mean, °F
The average column is Tavg + 6; the coldest column is the low point of the curve. The published paper’s parameter table prints the lag coefficient as −0.01, but its text and EnergyPlus both use −1.0, which is what we use. Station data and the calculation are listed on the methodology page.
Using it in the calculator
Enter your coldest-month value as the incoming water temperature in the calculator. The calculator starts at 50°F, which is on the cold side for much of the country: warmer than Duluth’s estimated winter low of about 36°F, far colder than Honolulu’s 81°F. For well water, use roughly the local annual average air temperature.
Incoming water questions
What is a typical incoming water temperature?
It ranges widely. Estimated from climate normals, annual-average mains temperatures run from about 44°F in Anchorage to about 84°F in Honolulu, and the coldest month is several to fifteen degrees colder than the average in most of the continental U.S. Measuring your own is better than any estimate.
Should I size a water heater for winter or average water temperature?
Size tankless for the coldest month, because the unit must deliver your peak flow at the largest rise it will see. For a tank, the coldest month is also when it delivers least and when showers run hotter, so it is the safer basis.
How do I measure my incoming water temperature?
Run a cold tap that is closest to where water enters the house, ideally one fed before any water softener or long run through a warm space, for several minutes until the temperature stops falling, then read a kitchen or thermometer probe in the stream. Do it in the coldest month if you can.
Is well water colder than city water?
Water from a well deeper than about 30 feet stays close to the local annual average air temperature all year, according to NREL. It swings less than city mains, so it is often warmer than city water in winter and colder in summer.
Sources
- Burch & Christensen, Towards Development of an Algorithm for Mains Water Temperature (NREL), ENERGY STAR (hosted).
- U.S. Climate Normals, 1991–2020, NOAA National Centers for Environmental Information.
- 10 CFR Part 430, Subpart B, Appendix E: Uniform test method for measuring the energy consumption of water heaters, eCFR.
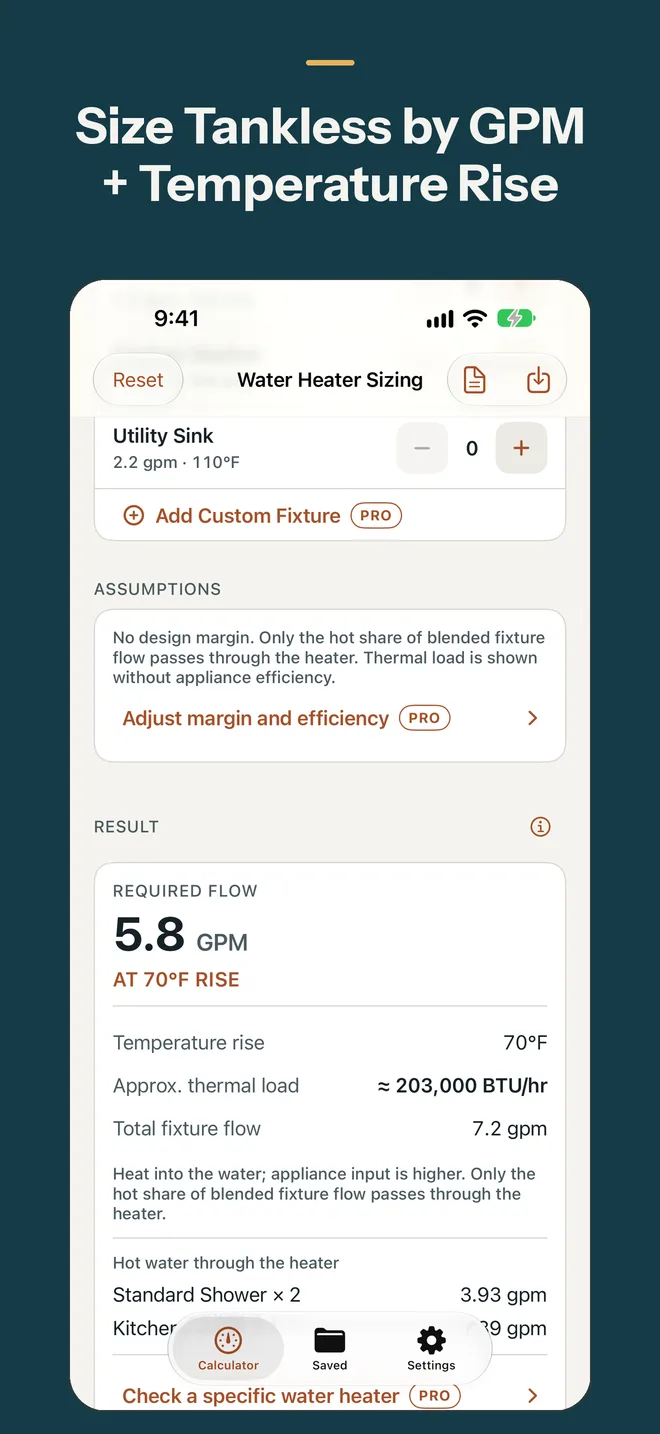
Water Heater Sizing Calculator for iPhone
Take the calculator to the job site
The app runs the same sizing engine as this site, offline. Basic tank and tankless sizing is free. Lifetime Pro, a one-time $4.99 purchase, adds tank vs. tankless comparison, custom fixtures, saved jobs with notes and PDF reports you can send to a customer.